Then, we come to the story of Joseph Farman, which we told you at the beginning. Joseph Farman, stationed in a research station in Antarctica, went there every year to measure the ozone level in the atmosphere. Suddenly, in 1982, his reading showed that 1/3rd of the ozone layer was already depleted over Antarctica. This reading was unbelievable because scientists had assumed that only 2-3% of the ozone layer will be depleted.
That’s why he thought that his machine must have broken down. So, the next year, they brought a new machine. And it showed the same reading again. Then he assumed that the problem must be with the location. So, he went to another location. And again, he saw the same thing. And when he went ahead and told NASA, NASA’s scientists measured it themselves, and these horrific images were released.
Here, we could see that each year, the ozone hole was widening so rapidly. All the theoretical predictions by the scientists, were drastically wrong. The situation was actually horrendously dangerous. In August 1985, the first map was shown to the world of the ozone hole, and how the ozone hole looked over Antarctica.
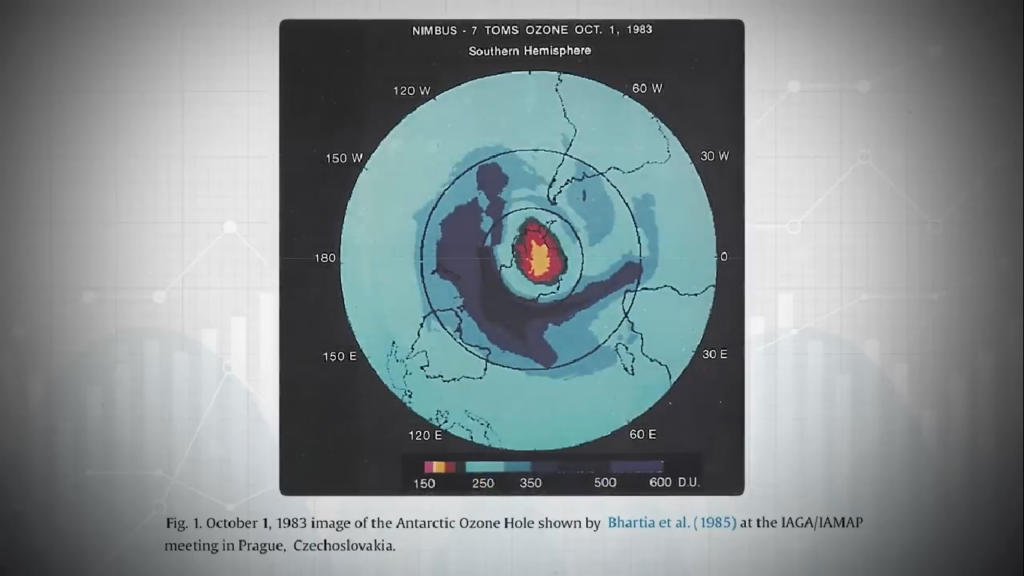
The measurements at the bottom of this map are in Dobson units (DU). As we told you, 300 to 500 units was the normal measurement of the thickness of the ozone layer. But in the middle of the ozone hole you can see that these measurements had fallen below 200 DU. In some places, it was almost 150 DU.